Puppets data - further visualizations
[1]:
# Not really required
import sys
sys.path.insert(0, '../../..')

from pyLDLE2 import visualize_all
visualize_all.visualize('../data/pyLDLE2/s1_puppets/ldle.dat')
matplotlib.get_backend() =  module://matplotlib_inline.backend_inline
##################################################
Data
##################################################
Cannot plot because input data has more than 3 features.
Cannot plot because input data has more than 3 features.
Eigenvalues
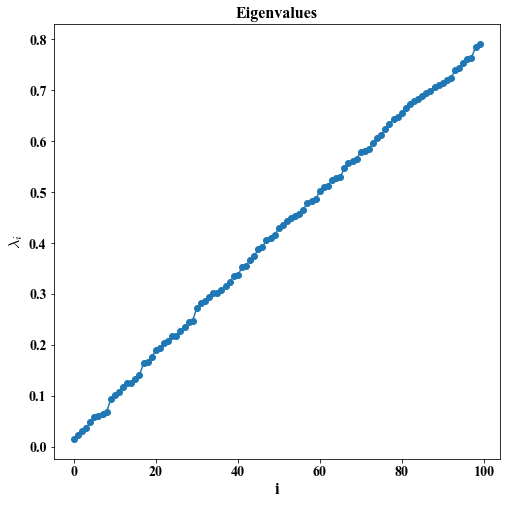
##################################################
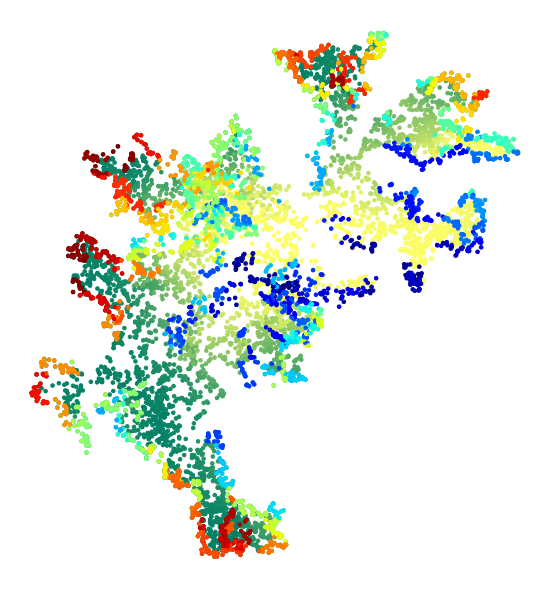
Eigenvectors on data
##################################################
Cannot plot because input data has more than 3 features.
Cannot plot because input data has more than 3 features.
Cannot plot because input data has more than 3 features.
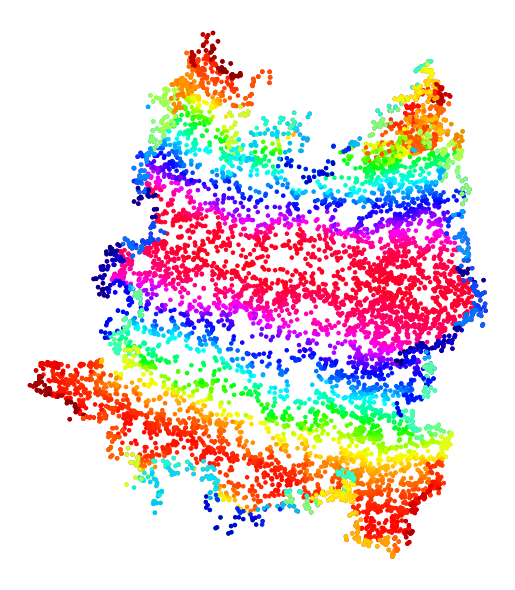
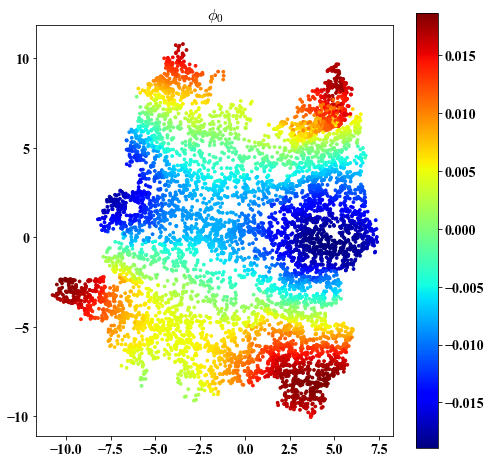
##################################################
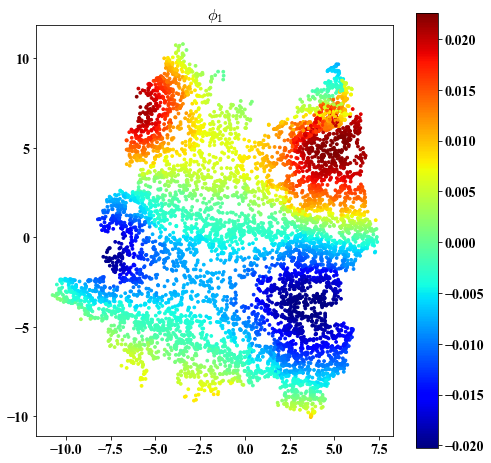
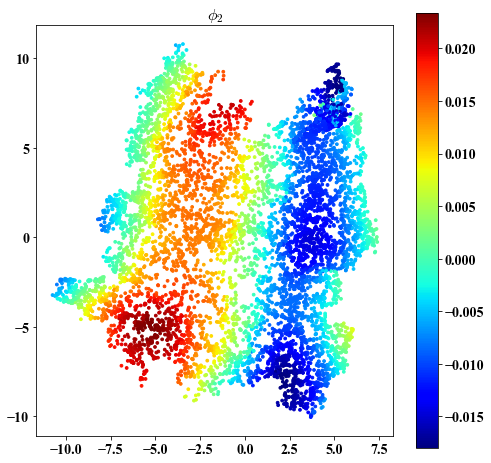
Eigenvectors on embedding
##################################################
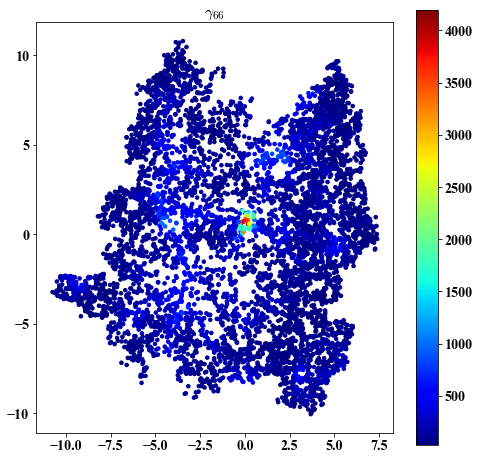
##################################################
gamma on data
##################################################
Cannot plot because input data has more than 3 features.
Cannot plot because input data has more than 3 features.
Cannot plot because input data has more than 3 features.
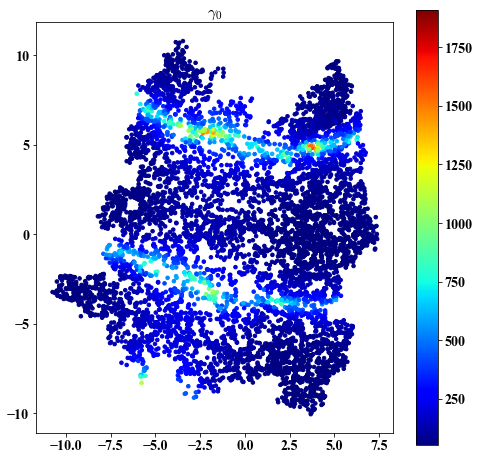
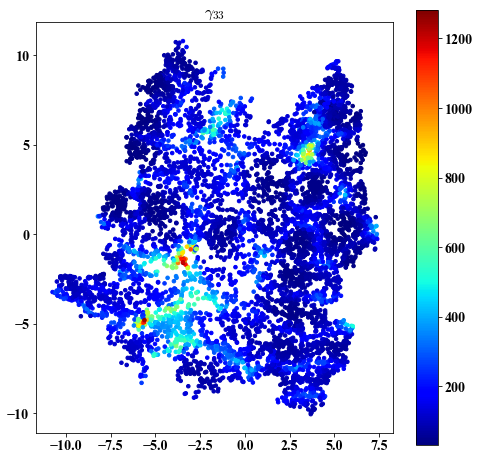
##################################################
gamma on embedding
##################################################
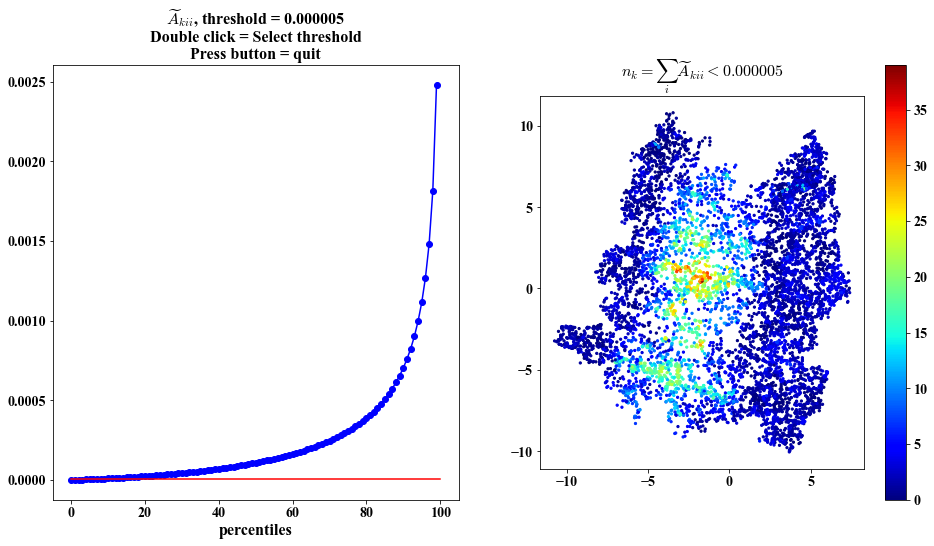
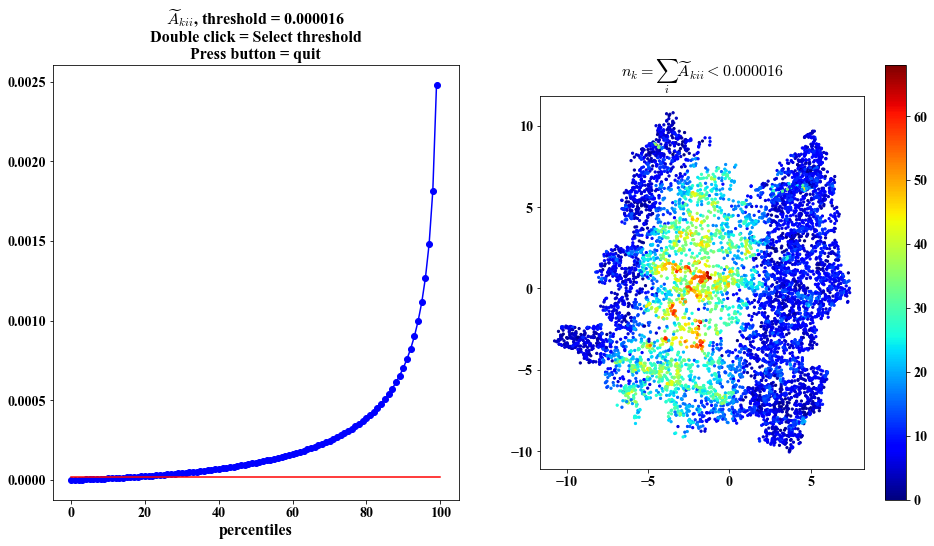
##################################################
No. of eigenvectors with small gradients at each point - possibly identifies boundary
##################################################
Cannot plot because input data has more than 3 features
##################################################
Same visualization as above but plots based on the embedding
##################################################

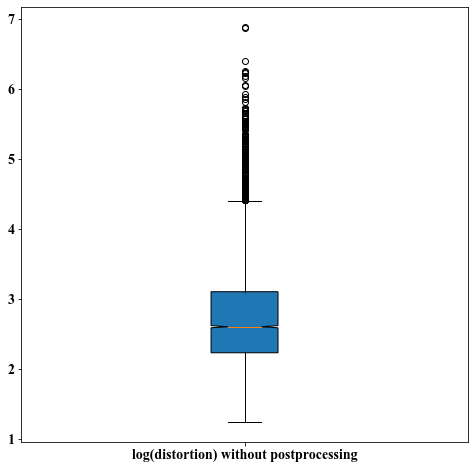
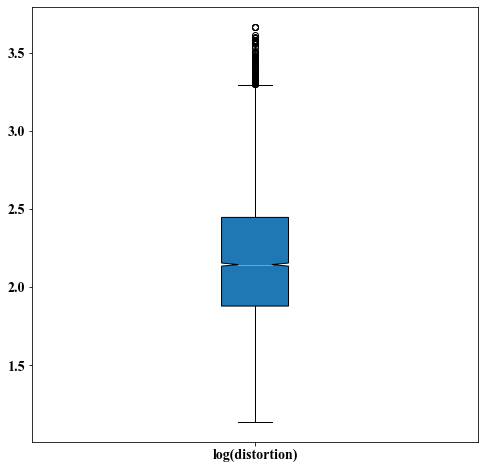
##################################################
Distortion of local parameterizations without post-processing
##################################################
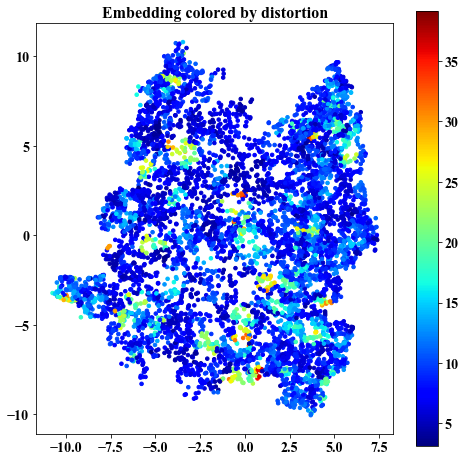
##################################################
Distortion of local parameterizations with post-processing
##################################################
Cannot plot because input data has more than 3 features

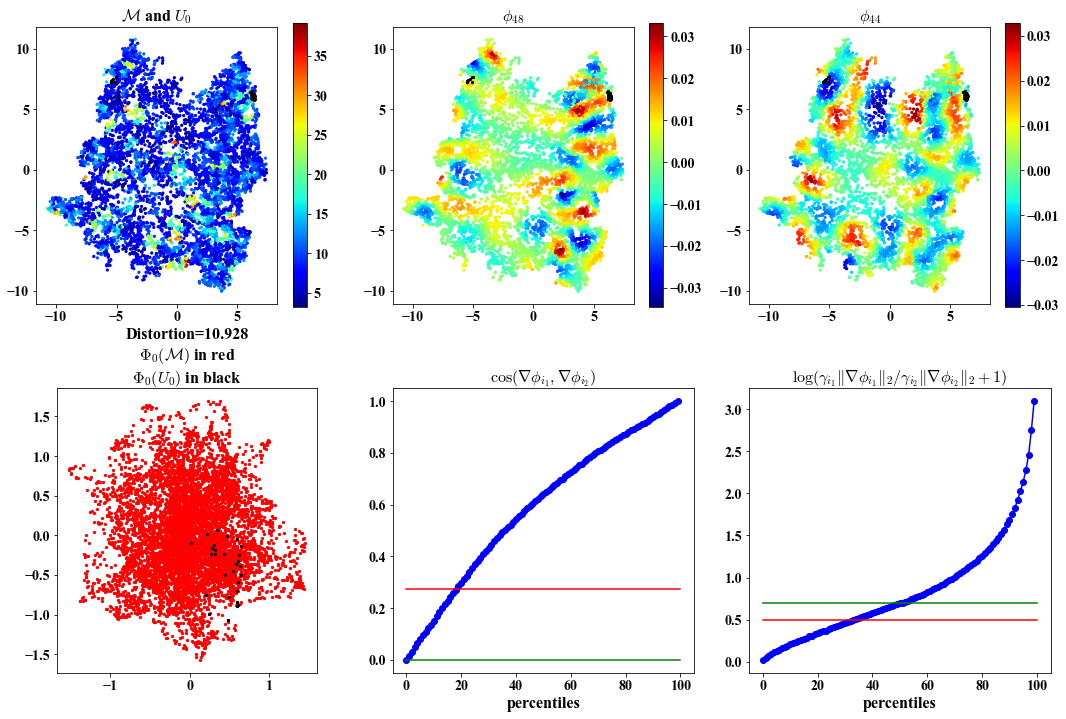
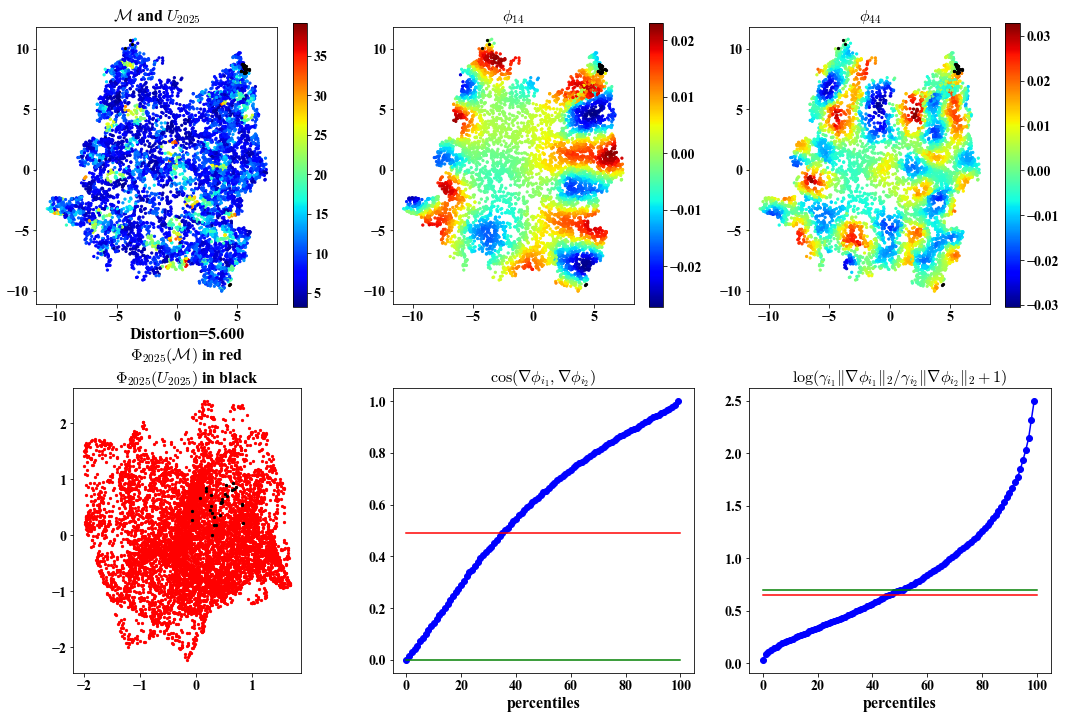
##################################################
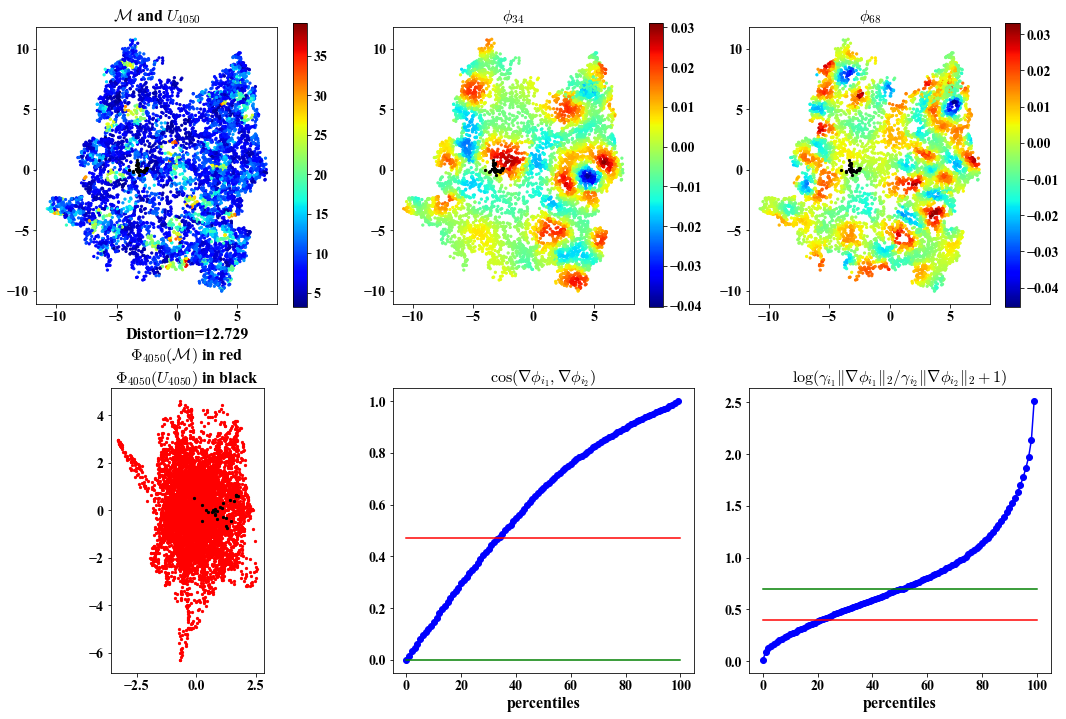
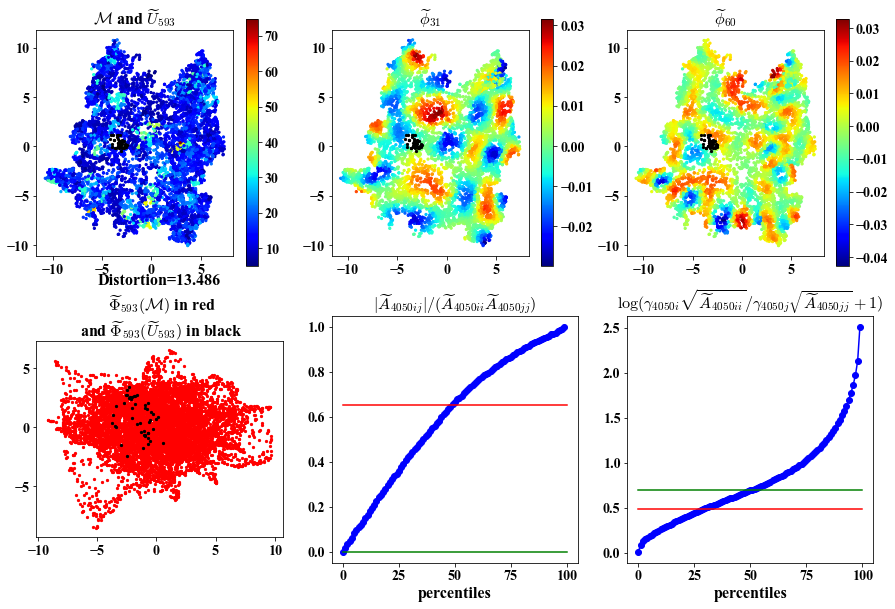
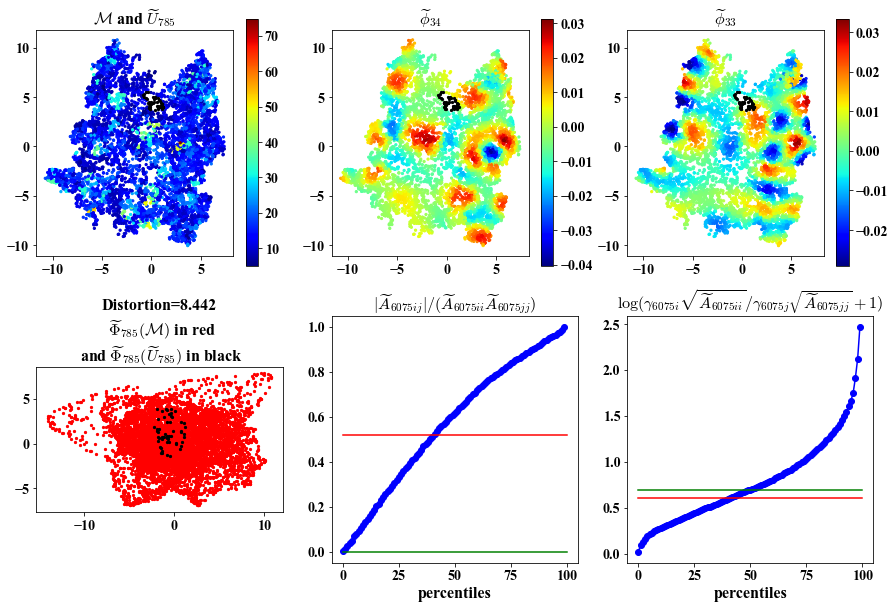
Here we visualize:
1. Local views in the ambient and embedding space.
2. Chosen eigenvectors to construct the local parameterization.
3. Deviation of the chosen eigenvectors from being orthogonal and having same length.
##################################################
Cannot plot because input data has more than 3 features
##################################################
Same visualization as above but plots based on the embedding.
##################################################
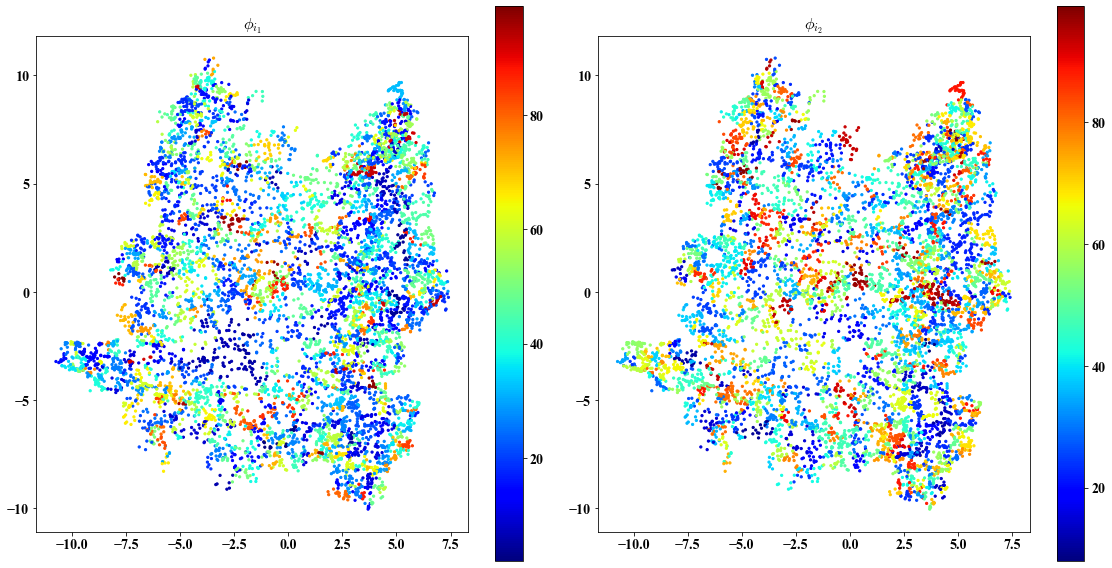
##################################################
Chosen eigenvectors indices for local views
##################################################
Cannot plot because input data has more than 3 features or embedding dim > 2
##################################################
Same visualization but plots based on embedding
##################################################
Sequence of intermediate views
##################################################
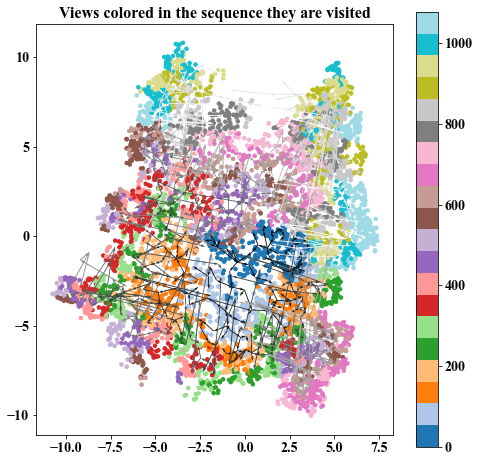
##################################################
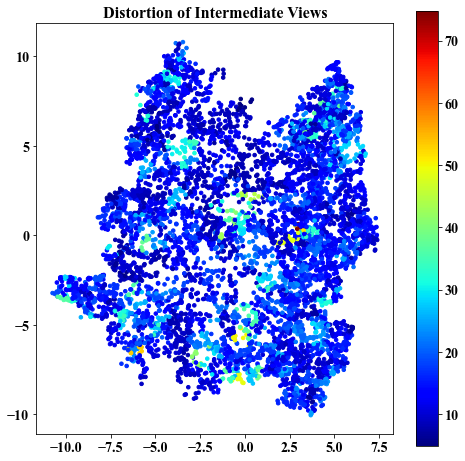
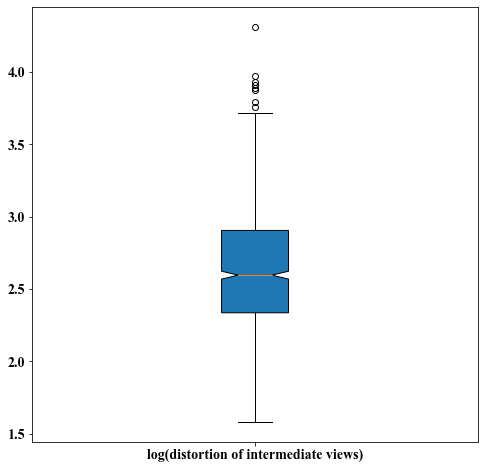
Distortion of intermediate views
##################################################
Cannot plot because embedding dim > 3
##################################################
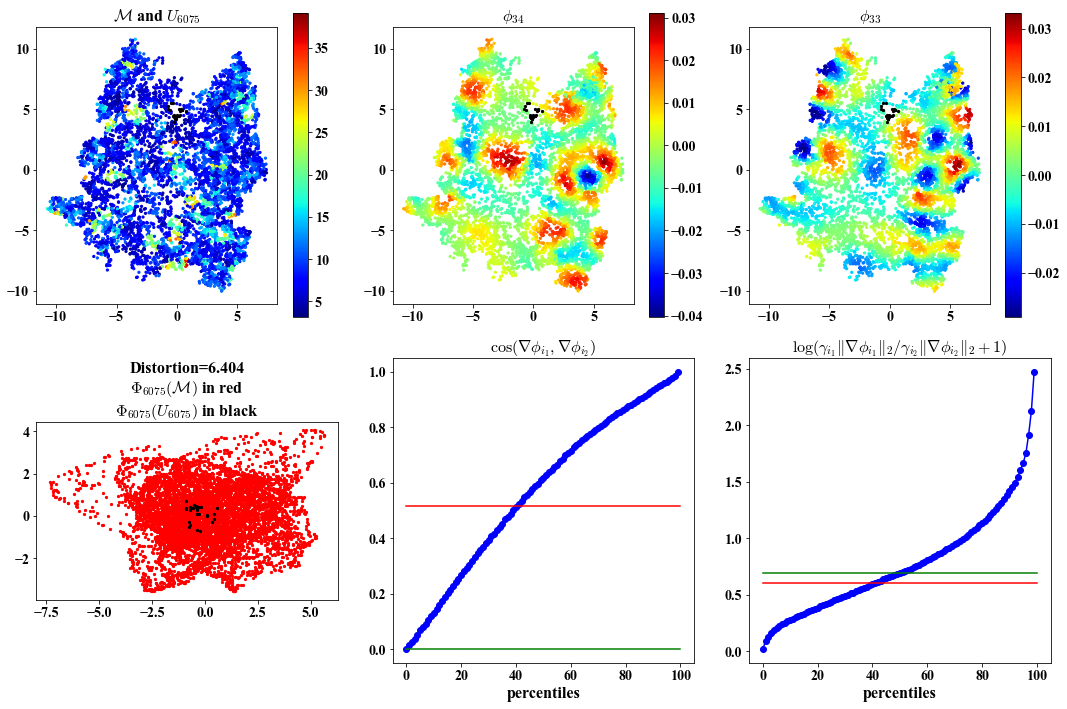
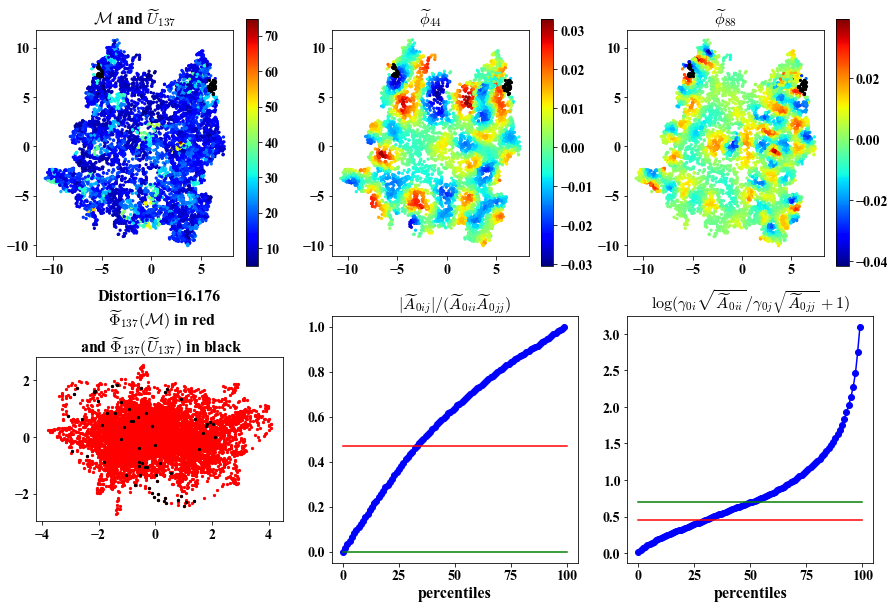
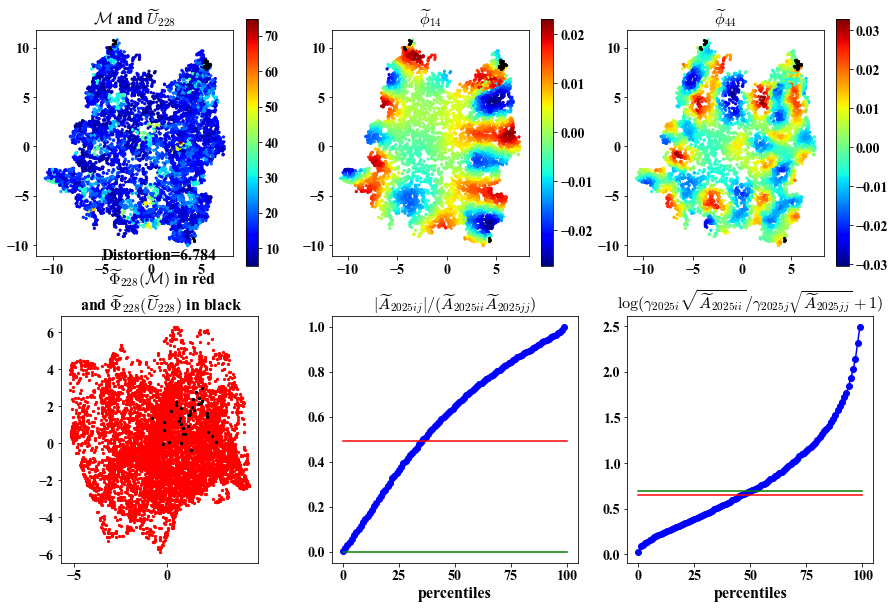
Here we visualize: 1. Intermediate views in the ambient and embedding space.
2. Chosen eigenvectors to construct the intermediate parameterization.
3. Deviation of the chosen eigenvectors from being orthogonal and having same length.
##################################################
Input has more than 3 features
##################################################
Same visualization as above but plots based on the embedding
##################################################
##################################################
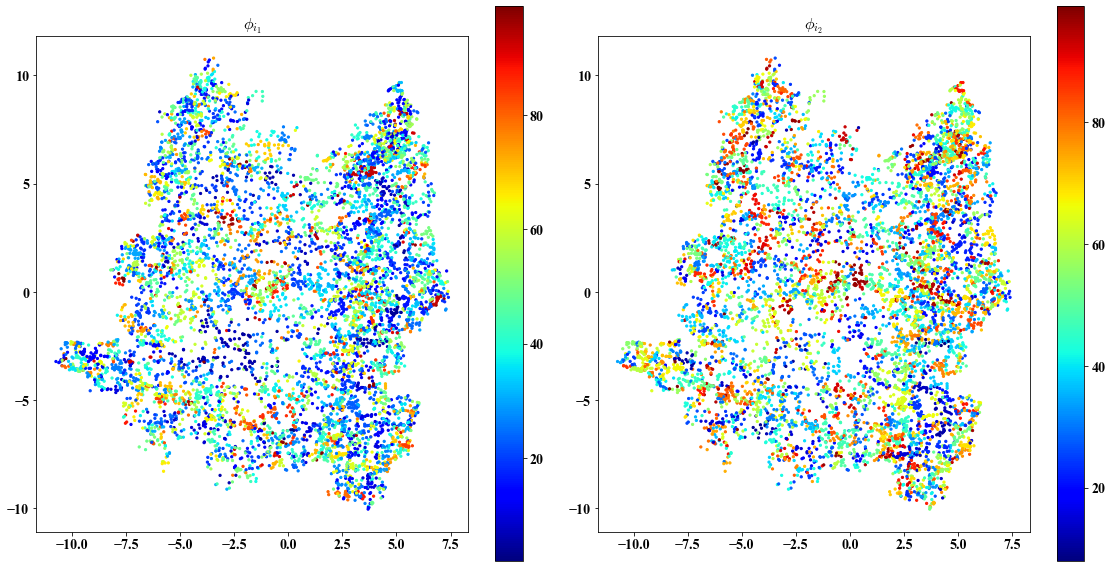
Chosen eigenvectors indices for intermediate views
##################################################
Cannot plot because input data has more than 3 features or embedding dim > 2
##################################################
Same visualization but plots based on embedding
##################################################
initial global embedding
##################################################
##################################################
final global embedding
##################################################
---------------------------------------------------------------------------
ValueError                                Traceback (most recent call last)
Input In [1], in <cell line: 6>()
      3 sys.path.insert(0, '../../..')
      5 from pyLDLE2 import visualize_all
----> 6 visualize_all.visualize('../data/pyLDLE2/s1_puppets/ldle.dat')

File ~/codebase/pyLDLE2/docs/ldle_nbks/real_world_examples/../../../pyLDLE2/visualize_all.py:402, in visualize(fpath, threshs, n_views, figsize1, figsize2, figsize3, s1, puppets_data, interact)
    399     print('Cannot plot because embedding dim > 3')
    401 if 'puppets' in fpath:
--> 402     X, labelsMat, buml_obj, img, img_shape = all_data[:5]
    403     buml_obj.vis.global_embedding_images_v2(img, img_shape[::-1], buml_obj.GlobalViews.y_final, labelsMat[:,0]*0,
    404                                 buml_obj.vis_opts['cmap_interior'], buml_obj.GlobalViews.color_of_pts_on_tear_final,
    405                                 buml_obj.vis_opts['cmap_boundary'], 'images',
    406                                 offset_ratio=0.2, zoom=0.4, nx=8, ny=10, v_ratio=0.65, w_ratio=0.005,
    407                                 figsize=(10,12), s=80, to_remove=False, k_to_avoid=[], to_T=True)
    408     buml_obj.vis.global_embedding(buml_obj.GlobalViews.y_final, X[:,0], 'summer',
    409                               buml_obj.GlobalViews.color_of_pts_on_tear_final, buml_obj.vis_opts['cmap_boundary'],
    410                               'Final Embedding 2', figsize=(5,5), s=50)

ValueError: not enough values to unpack (expected 5, got 3)